6 Model Merging
Each species may have distribution data in multiple source datasets (see Chapter 3). The model merging pipeline combines these into a single merged model per species, applying spatial masking and minimum floor values to reflect regulatory protections.
TipInteractive Walkthrough
The Scoring Walkthrough visualizes the merge process interactively — see how MAX merge, spatial masking, and regulatory floors transform input rasters step by step.
6.1 Pipeline Overview
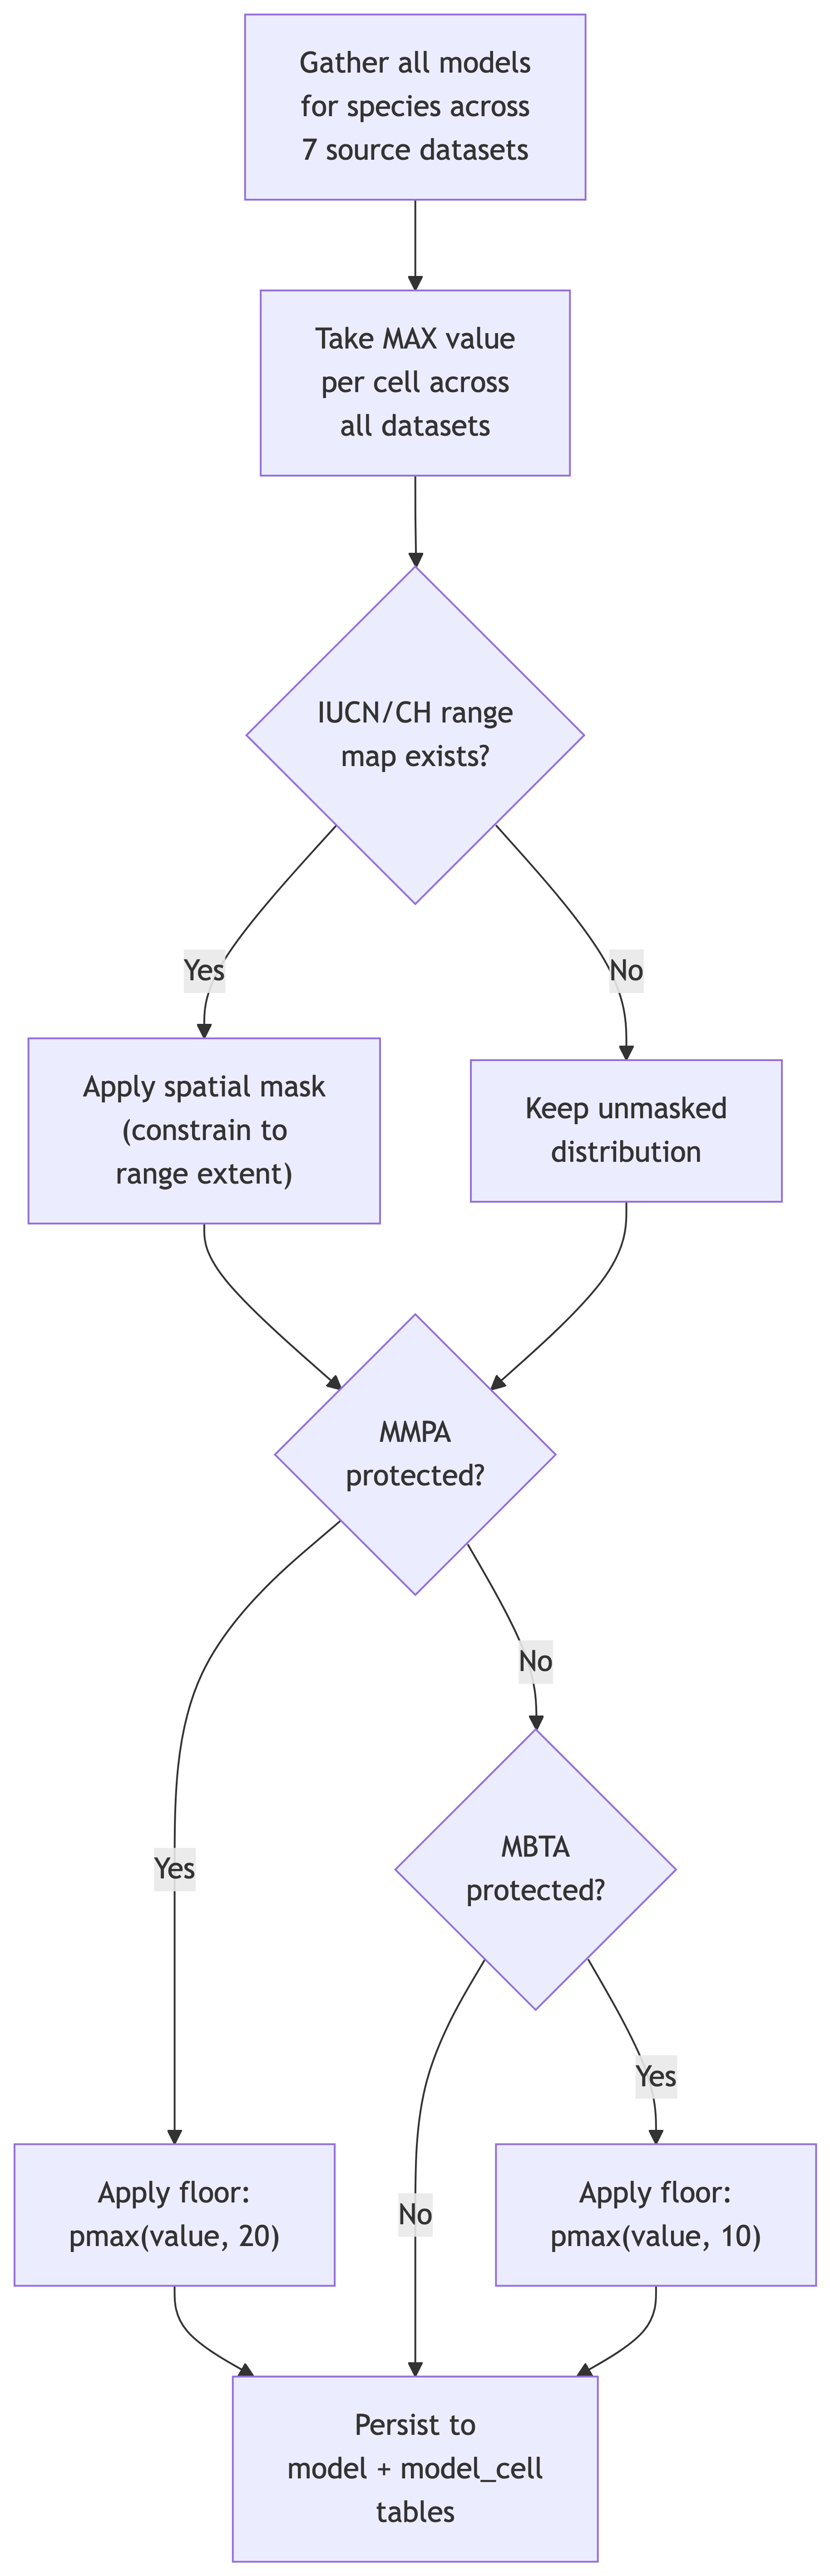
The merge pipeline processes each valid species through the following steps:
6.1.1 Step 1: Gather Source Models
For each species (identified by taxa_id), the pipeline queries all available models across the 8 source datasets. A species may have:
- an AquaMaps SDM (continuous suitability)
- one or more regulatory range/habitat designations (NMFS, FWS)
- a BirdLife or IUCN range map
- a SWOT+DPS range map (sea turtles only)
6.1.2 Step 2: MAX Across Datasets
For each grid cell, the merged value is the maximum suitability across all source datasets:
\[ v_{merged,c} = \max(v_{am,c},\; v_{ca,c},\; v_{ch,c},\; v_{rng,c},\; v_{bl,c},\; v_{iucn,c}) \tag{6.1}\]
This ensures that the most informative (highest confidence) prediction is used. For example, if AquaMaps predicts 30% suitability but NMFS has designated the cell as critical habitat for an endangered species (100%), the merged value is 100%.
6.1.3 Step 2b: Turtle Multiplicative Merge
For sea turtles (6 species), the merge uses a multiplicative approach instead of simple MAX. The SWOT+DPS dataset provides a spatially varying extinction risk (ER) surface where cell values encode the ESA listing status of the Distinct Population Segment (DPS) that overlaps each cell (Endangered = 100, Threatened = 50). This ER surface is multiplied with the suitability surface (from AquaMaps or other SDMs) during merging:
\[ v_{merged,c} = \max\!\Big(1,\; \mathrm{round}\!\Big(\frac{v_{er,c} \times v_{suit,c}}{100}\Big)\Big) \tag{6.2}\]
where:
- \(v_{er,c}\) = extinction risk value from SWOT+DPS raster (EN: 100, TN: 50)
- \(v_{suit,c}\) = suitability value from AquaMaps SDM (1–100)
Critical habitat cells (NMFS or FWS designated) override via MAX — if the critical habitat value exceeds the multiplicative product, the higher value is used.
Because extinction risk is already embedded in the merged values, these species receive er_score = 100 at scoring time as a pass-through multiplier (flagged via is_er_spatial). This contrasts with the standard approach where all species receive a single scalar extinction risk weight applied during scoring (see Chapter 7).
NoteTwo modeling approaches
The MST uses two distinct merge strategies:
- Standard (most species): MAX across input rasters, then multiply by a scalar extinction risk score at scoring time
- Turtles only: Multiply suitability raster by an extinction risk raster during merging, embedding spatially varying ER directly in the merged model
See the Scoring Walkthrough for an animated side-by-side comparison.
6.1.4 Step 3: Spatial Masking
When a range map or designated habitat exists for a species, the merged model is constrained to the spatial extent of these mask datasets. The mask is formed as the union of all available is_mask = TRUE datasets for that species.
For most taxa, the IUCN range map serves as the global mask. For sea turtles, the SWOT+DPS dataset (rng_turtle_swot_dps; see Section 3.2.8) replaces the IUCN range as the global mask, providing more realistic distributions based on expert-reviewed SWOT polygons with ESA-based DPS status encoding. NMFS Critical Habitat and FWS Critical Habitat also contribute to the mask when designated.
This prevents the AquaMaps SDM (which often has broad environmental envelope predictions) from extending species presence far beyond their known range. Cells outside the mask are set to zero (species absent). This ensures that suitable habitat is not included outside known ranges, so that model predictions align with expert knowledge of where species actually occur.
Importantv6 fix: species with ranges outside the US EEZ
Species whose IUCN expert range polygon produces zero cells when rasterized to the US EEZ grid now receive a 0-cell rng_iucn entry in the database (rather than being silently skipped during ingestion). The merge clips AquaMaps predictions against this empty mask, producing zero merged cells, and the species is flagged is_ok=FALSE. This excluded 371 species (343 fish, 20 invertebrates, 6 corals, 2 mammals) that had spurious AquaMaps edge-of-range predictions in US waters despite IUCN expert assessment placing them entirely outside the US EEZ. The quantitative impact on Program Area scores is negligible because the removed species had near-zero suitability values.
6.1.5 Step 4: MMPA Spatial Floor
For species protected under the Marine Mammal Protection Act (all marine mammals), a spatial minimum floor is applied:
\[ v_{c} = \max(v_{merged,c},\; 20) \tag{6.3}\]
This ensures that every cell where a marine mammal is present has a minimum value of 20%, reflecting the legal protection that MMPA affords regardless of ESA status. This includes both NMFS-managed species (whales, dolphins, seals, sea lions) and FWS-managed species (walrus, polar bear, sea otter, manatee, dugong).
Importantv5 fix: FWS-managed marine mammals
As of v5, the MMPA floor is correctly applied to all marine mammals regardless of managing agency. Earlier versions incorrectly excluded FWS-managed species (walrus, polar bear, sea otter, manatee, dugong) from this floor because the is_mmpa flag was derived only from the NMFS Species Directory.
6.1.6 Step 5: MBTA Spatial Floor
Similarly, for species protected under the Migratory Bird Treaty Act (most seabirds), a spatial minimum floor of 10% is applied:
\[ v_{c} = \max(v_{merged,c},\; 10) \tag{6.4}\]
6.1.7 Step 6: Persist Results
The final merged model is stored in the DuckDB database as:
modeltable: one row per species with metadata (dataset keyms_merge, taxa reference, model sequence)model_celltable: one row per species × cell combination with the merged suitability value
6.2 Valid Species Filter
After merging, species are flagged as valid (is_ok = TRUE) based on the criteria described in Chapter 4. The filtering rules differ slightly between birds and other taxa:
Birds (from BirdLife BOTW):
- has a
botw_id(BirdLife identifier) - IUCN Red List code is not “EX” (Extinct)
- if also in WoRMS: must be marine and not extinct
Other marine taxa (from WoRMS):
- has a
taxa_idand a merged model (mdl_seq) - IUCN Red List code is not “EX”
- WoRMS
isMarine = TRUEandisExtinct != TRUE - species category is not “reptile” (except sea turtles, which are reclassified as category “reptile”)
As of v7, an overlap with a BOEM Program Area is no longer required for validity (it previously narrowed the set to 9,424); Program-Area scope is now a spatial/zone query so the full study-area biodiversity is retained.
This filtering yields 16,153 valid species across the study area, of which 9,230 contribute to scores within the 20 BOEM Program Areas of the current program cycle.