| Dataset key | Name | Cell values | Mask | Taxa | Share |
|---|---|---|---|---|---|
am_0.05 |
AquaMaps SDM | No | 15,665 | 97.0% | |
ca_nmfs |
NMFS Core Area | Core: 100 | Yes | 1 | <0.1% |
ch_nmfs |
NMFS Critical Habitat | EN:100, TN:50 | Yes | 26 | 0.2% |
ch_fws |
FWS Critical Habitat | EN:100, TN:50 | Yes | 21 | 0.1% |
rng_fws |
FWS Range | EN:100, TN:50, LC:1 | Yes | 70 | 0.4% |
bl |
BirdLife Range | CR:50, EN:25, VU:5, NT:2, LC:1, DD:1 | Yes | 441 | 2.7% |
rng_iucn |
IUCN Range | CR:50, EN:25, VU:5, NT:2, LC:1, DD:1 | Yes | 2,619 | 16.2% |
rng_turtle_swot_dps |
SWOT+DPS Turtle Range | EN:100, TN:50 | Yes | 6 | <0.1% |
6 Data Sources
The MST integrates species distributions from 8 source datasets, though not in equal measure — am_0.05 alone supplies the distribution of 97% of this release’s valid species. Each source predicts where a species occurs, and they differ in kind: continuous suitability models, habitats tied to a core area, critical habitat or distinct population segment, and expert range maps.
Note
The counts and citations on this page are read from v7’s own published dataset table, so they describe that release rather than the current one. Earlier releases integrated fewer sources: the table below is the answer for this version.
6.1 Dataset overview
ImportantCoverage is very uneven — read the Taxa column, not the row count
Broad coverage. am_0.05 (15,665), bl (441), rng_iucn (2,619) — between them these account for the distribution of essentially every scored species.
Targeted designations. ca_nmfs (1), ch_nmfs (26), ch_fws (21), rng_fws (70), rng_turtle_swot_dps (6) — each under 1% of valid species. These are legal designations and expert ranges for specific taxa (critical habitat, core areas, sea turtle ranges), so they are small by nature rather than incomplete; they raise the value of the cells they cover rather than extending coverage to new species.
The merged model (ms_merge) is the derived output rather than a source, so it is excluded from the table above: for each taxon it takes the maximum value across that taxon’s source datasets in each cell, constrained to the taxon’s expert range where one exists (see Chapter 9).
In v7 the merged model covers 9,424 of the 16,153 valid species (58%). The remainder carry a single source model directly — this release merges only where a taxon has more than one contributing dataset, so most species are scored straight from their source.
6.2 The sources
6.2.1 AquaMaps SDM (am_0.05)
AquaMaps species distribution models downscaled from 0.5° to 0.05° cells
- Models: 17,550
- Response: suitability
- Coverage: Global
- Taxa: all taxa, except birds
- Role: contributes values
Kaschner, K., K. Kesner-Reyes, C. Garilao, J. Segschneider, J. Rius-Barile, T. Rees, and R. Froese. 2019. AquaMaps: Predicted range maps for aquatic species. World wide web electronic publication, www.aquamaps.org, Version 10/2019. Content from AquaMaps as provided in this R package is licensed under a Creative Commons Attribution-NonCommercial 3.0 UnportedLicense, please see http://creativecommons.org/licenses/by-nc/3.0/
6.2.2 NMFS Core Area (ca_nmfs)
Core distribution areas designated by NOAA Fisheries for species with restricted ranges, used as high-confidence habitat indicators.
- Models: 1
- Response: binary
- Cell values: Core: 100
- Coverage: USA
- Taxa: cetaceans
- Role: contributes values and constrains the merged range
6.2.3 NMFS Critical Habitat (ch_nmfs)
The National Marine Fisheries Service (NMFS) developed this geodatabase to standardize its Endangered Species Act (ESA) critical habitat spatial data.
- Models: 34
- Response: binary
- Cell values: EN:100, TN:50
- Coverage: USA
- Taxa: all taxa
- Role: contributes values and constrains the merged range
6.2.4 FWS Critical Habitat (ch_fws)
This page contains the spatial data for active proposed and final critical habitat for FWS only and Joint FWS/NMFS threatened and endangered species. ECOS is a FWS-sponsored platform for FWS data. The ECOS critical habitat on-line mapper includes (some, not all of the) proposed and final critical habitat for species listed as Threatened and Endangered by the FWS, or that are jointly managed by FWS/NMFS. The on-line mapper does not include species which are under the sole jurisdiction of NMFS.
- Models: 29
- Response: binary
- Cell values: EN:100, TN:50
- Coverage: USA
- Taxa: all taxa
- Role: contributes values and constrains the merged range
6.2.5 FWS Range (rng_fws)
This is a dataset representing the polygonal boundaries for species as understood by the United States Fish and Wildlife Service.
- Models: 106
- Response: binary
- Cell values: EN:100, TN:50, LC:1
- Coverage: USA
- Taxa: all taxa
- Role: contributes values and constrains the merged range
6.2.6 BirdLife Range (bl)
This dataset contains digital distribution information for the world’s birds. It is a joint product of BirdLife International and Handbook of the Birds of the World.
- Models: 573
- Response: binary
- Cell values: CR:50, EN:25, VU:5, NT:2, LC:1, DD:1
- Coverage: Global
- Taxa: birds
- Role: contributes values and constrains the merged range
6.2.7 IUCN Range (rng_iucn)
This dataset contains distribution information on species assessed for The IUCN Red List of Threatened Species™. The maps are developed as part of a comprehensive assessment of global biodiversity in order to highlight taxa threatened with extinction, and thereby promote their conservation.
- Models: 3,766
- Response: binary
- Cell values: CR:50, EN:25, VU:5, NT:2, LC:1, DD:1
- Coverage: Global
- Taxa: all taxa (except birds)
- Role: contributes values and constrains the merged range
IUCN Red List of Threatened Species. Version 2025-2. <www.iucnredlist.org>. Downloaded on 21 January 2026.
6.2.8 SWOT+DPS Turtle Range (rng_turtle_swot_dps)
SWOT sea turtle global distributions overlaid with NMFS Endangered Distinct Population Segments. EN DPS areas coded as Endangered (value=100), remainder as Threatened (value=50).
- Models: 6
- Response: binary
- Cell values: EN:100, TN:50
- Coverage: Global
- Taxa: turtles
- Role: contributes values and constrains the merged range
Wallace BP et al. (2023) Marine turtle regional management units 2.0. Endangered Species Research 52:209-223. DOI:10.3354/esr01243
6.3 Notes on individual sources
6.3.1 AquaMaps vintage
AquaMaps is the foundational dataset for most taxa: environmental-envelope models of habitat suitability as a function of depth, temperature, salinity, primary productivity, ice concentration and distance from land (Kaschner et al. 2019). The model vintage is AquaMaps Version 10/2019 — the release named in the citation above, and the one the registry records as its environmental end date. Later dates that appear alongside AquaMaps in project records are retrieval dates for that same 2019 release, not a newer one; the underlying suitability surfaces have not changed.
Models are native to a 0.5° grid (c-squares) and are interpolated onto the analysis grid bilinearly, implemented as a precomputed weight join rather than a per-species raster resample. Source cells that are absent contribute zero, so a distribution fades to zero within about one cell of its edge rather than ending on a hard step.
6.3.2 Where each representation lives
Several inputs are published in two representations: the Original, at the source’s own resolution (AquaMaps’ 0.5° grid, or a vector range as delivered), and the Interpolated surface on the 0.05° analysis grid that scoring used. The originals are stored under native/{ds_key}/ and the gridded surfaces under cog/{grid_id}/ in the shared, content-addressed store (Section 15.3), and each release’s native_asset table points at both. Because the file name is derived from the source content, a dataset that is unchanged between releases is stored once and pointed at by each release that uses it, rather than copied into every release. An input delivered directly on the analysis grid has nothing to interpolate, but may still have two representations that differ in content rather than resolution: AquaX (v9) publishes the band as delivered beside the surface as ingested (the thresholded, integer values the merge consumed), and the Atlas labels that pair Delivered / As ingested. An input that is gridded from the start with nothing else to show (the NMFS DPS extinction-risk surfaces, and the v7 ranges whose original could not be matched) has a single representation.
6.3.3 Sea turtles: why a dedicated range dataset
Sea turtle distributions from AquaMaps and from IUCN range maps were both too broad, extending well beyond where the species actually occur. Several species also carry different ESA protection in different parts of their range, through NOAA Fisheries Distinct Population Segments (DPS) — which a single global range map cannot express.
The SWOT+DPS dataset replaces the IUCN range as the global mask for all six sea turtle species, combining SWOT Global Distributions (Wallace et al. 2023) for realistic range polygons with the NOAA Fisheries ESA Species Range Geodatabase (NOAA Fisheries 2025) for DPS listing status. Where DPS data exist (Loggerhead, Green, Olive Ridley), Endangered DPS areas take the Endangered value and the remainder of the SWOT range the Threatened value; for species Endangered throughout (Leatherback, Hawksbill, Kemp’s Ridley) the entire range takes the Endangered value.
6.3.4 Range maps as masks
Datasets marked Mask do double duty: they contribute cell values and define the spatial extent a taxon’s merged distribution may occupy. This is what stops an environmental-envelope model from asserting presence far outside a species’ known range — see Chapter 9.
6.4 Standard grid
All datasets are aligned to the usa05 grid (US study area, 0.05 deg (0-360 frame)): 3,103 × 2,006 cells of 0.05° at 0–360 longitudes. At mid-latitudes a cell is roughly 4 × 4 km (~16 km2). Every cell carries a cell_id, which is what joins spatial data to every table in the database.
This release carries 662,075 cells.
Warning
cell_id means a different place on different grids
The grid changed at v8, from a regional grid on 0–360 longitudes to a global grid on −180 to 180. A given cell_id therefore denotes an entirely different location in v7 and in v8. Cell ids are meaningful only together with the grid_id the manifest declares, and the cell-id rasters are lookup images — a grid’s geometry cannot be inferred from one.
6.5 Primary productivity
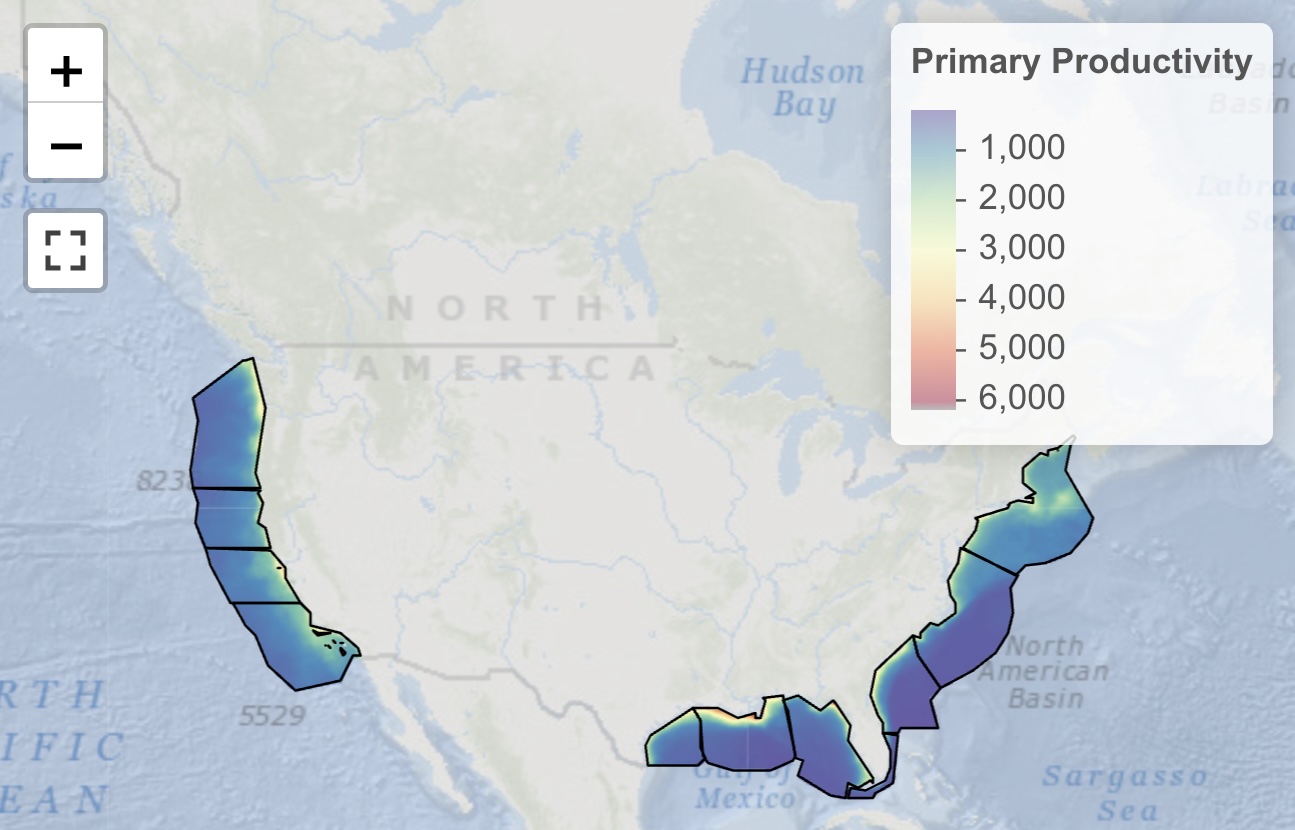
Primary productivity is an explicit statutory consideration: Section 18(a)(2) of the 1978 OCSLA Amendments requires the Department of the Interior to weigh “the relative environmental sensitivity and marine productivity of different areas of the OCS” in the timing and location of OCS activities.
We use satellite-derived net primary productivity (NPP) from the Vertically Generalized Production Model [VGPM; Behrenfeld and Falkowski (1997)] produced by Oregon State’s Ocean Productivity Lab, based on VIIRS data for 2014–2023. Values are converted to metric tons C km-2 yr-1 and averaged over the period. NPP enters scoring as its own metric, without extinction-risk weighting (see Chapter 10).