21 Atlas User Guide
Step-by-step walkthrough of the Atlas, one control at a time
This guide walks through the Atlas (marinesensitivity.org/atlas/?ver=v2) one control at a time. Each numbered step below mirrors a step in the Atlas’s built-in Take a tour (click (?) Help › Take a tour on a desktop, or ⋯ More › Take a tour on a phone, to walk the same path live), with the relevant control highlighted on the screenshot, and links to open that step’s view in the Atlas itself.
For a feature-by-feature reference instead, see the Atlas chapter (Chapter 21). The Scores and Species Shiny apps that came before the Atlas have their own, frozen step-by-step guide in the Legacy appendix.
The steps, captions, and highlighted screenshots are generated directly from the Atlas’s own guided tour (the driver.js step data in src/shell/tour.ts of the atlas repository). From the atlas repository, node scripts/tour-guide.mjs --out <docs>/figures/atlas-guide walks the tour on a running build of the Atlas, re-captures a screenshot with each step’s control highlighted, and writes figures/atlas-guide/steps.json into this book. So whenever the tour changes, re-running that one script refreshes this whole page.
Screenshots captured from the live Atlas 0.10.91 (7e6d326), release v7, 2026-10-16.
21.1 Atlas — Scores lens
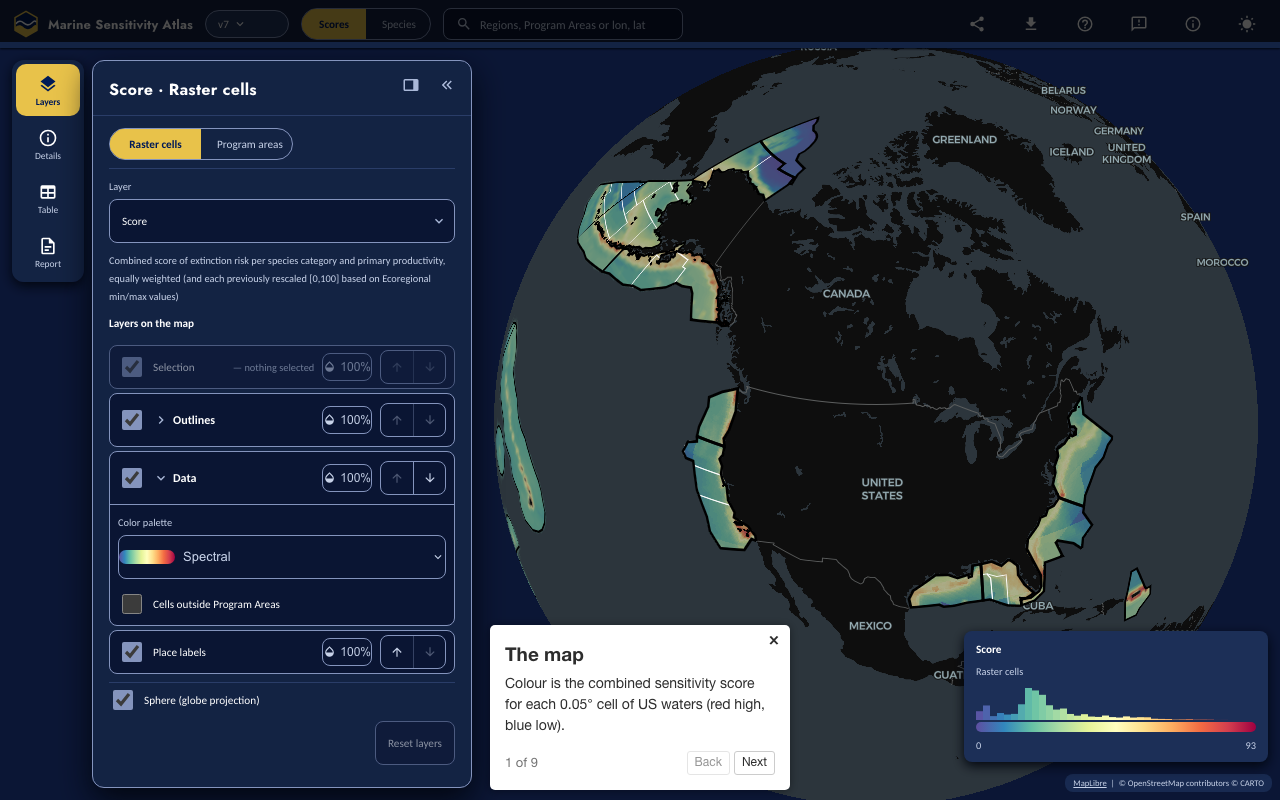
21.1.1 1. The map
Colour is the combined sensitivity score for each 0.05° cell of US waters (red high, blue low).
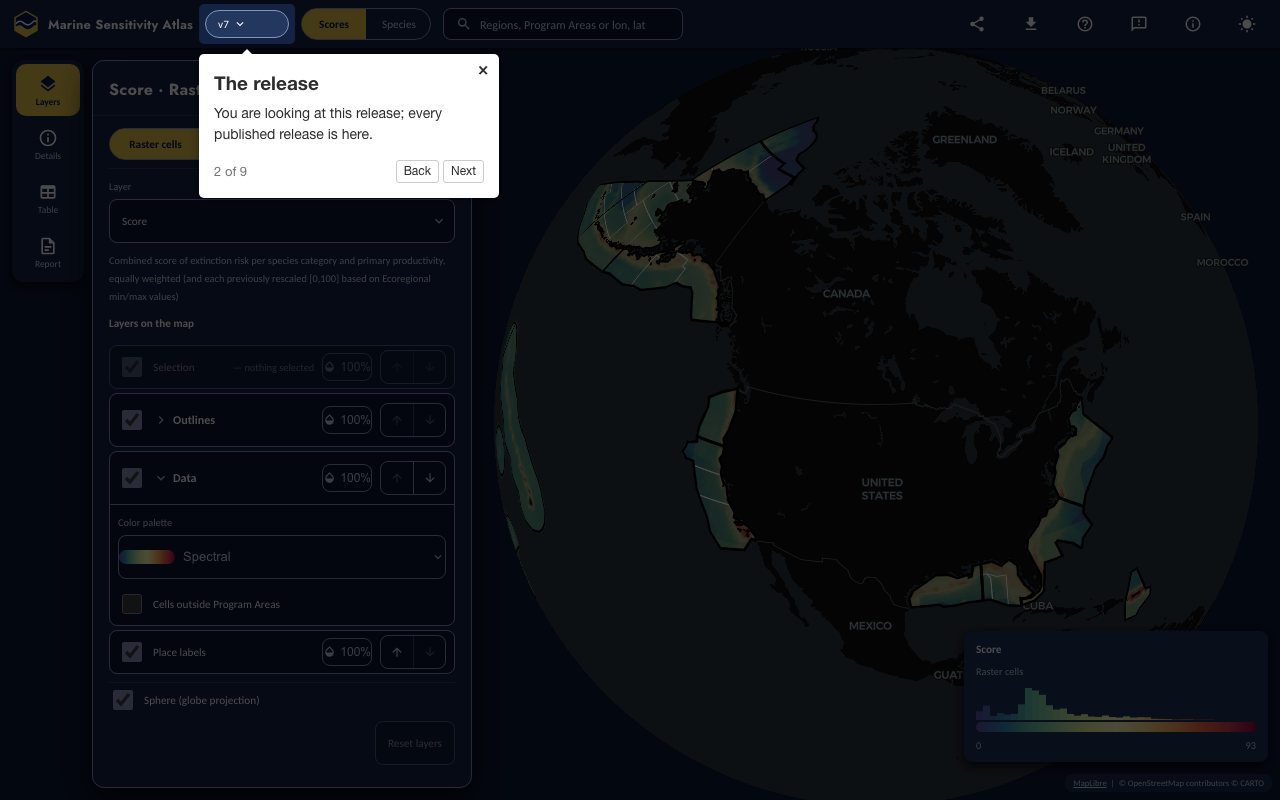
21.1.2 2. The release
You are looking at this release; every published release is here.
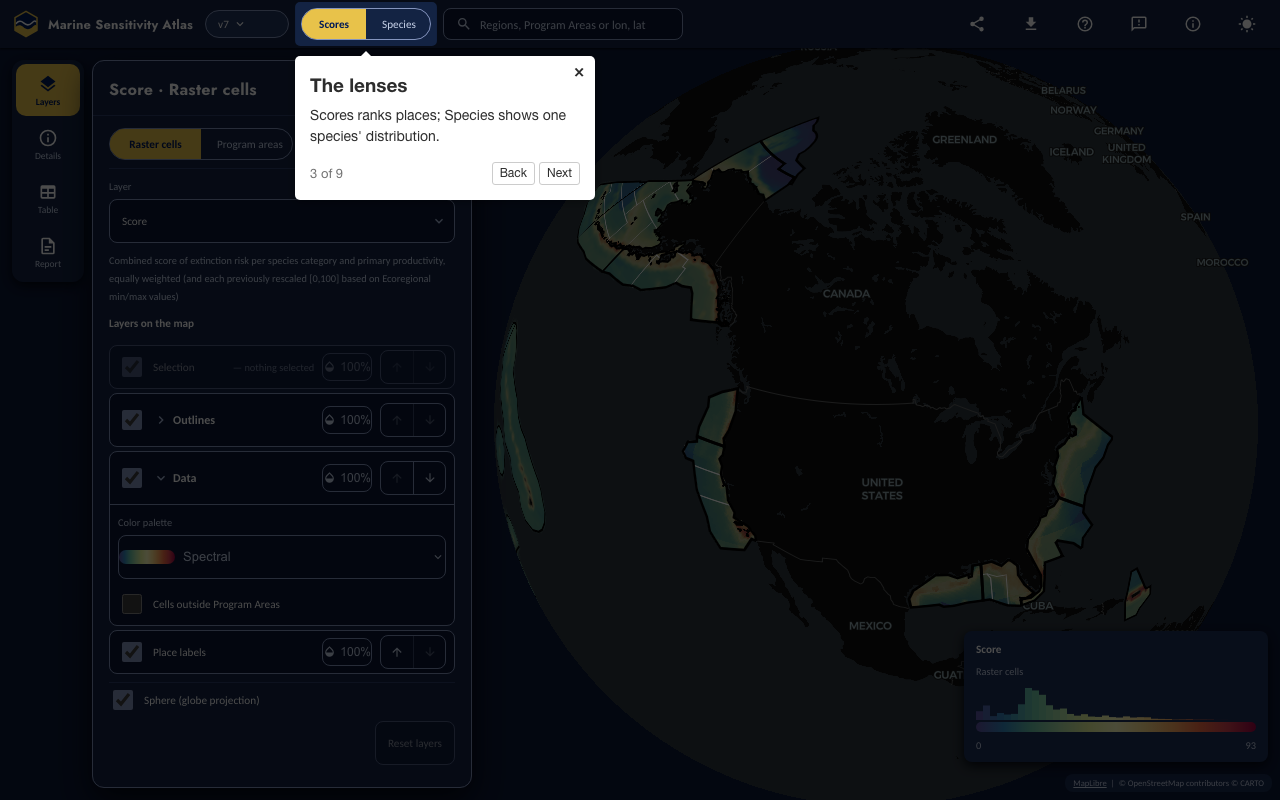
21.1.3 3. The lenses
Scores ranks places; Species shows one species’ distribution.
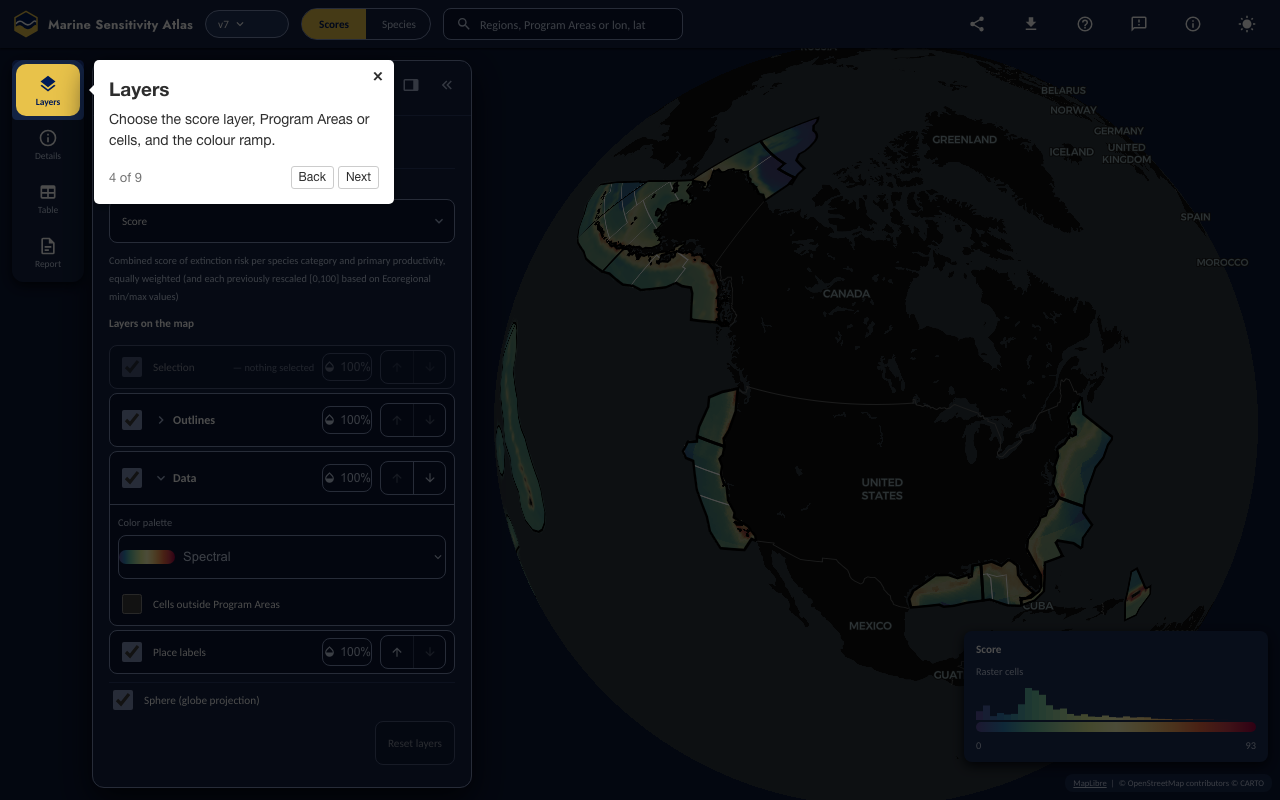
21.1.4 4. Layers
Choose the score layer, Program Areas or cells, and the colour ramp.
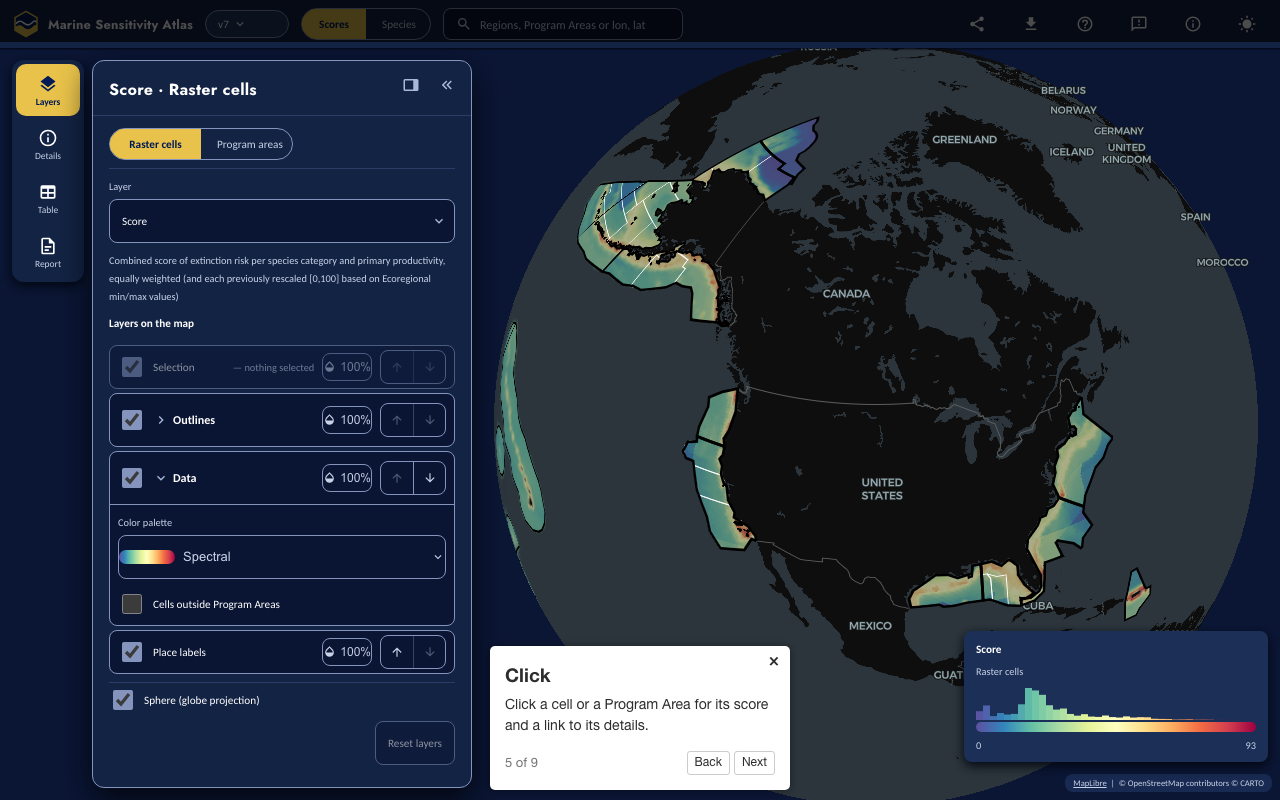
21.1.5 5. Click
Click a cell or a Program Area for its score and a link to its details.
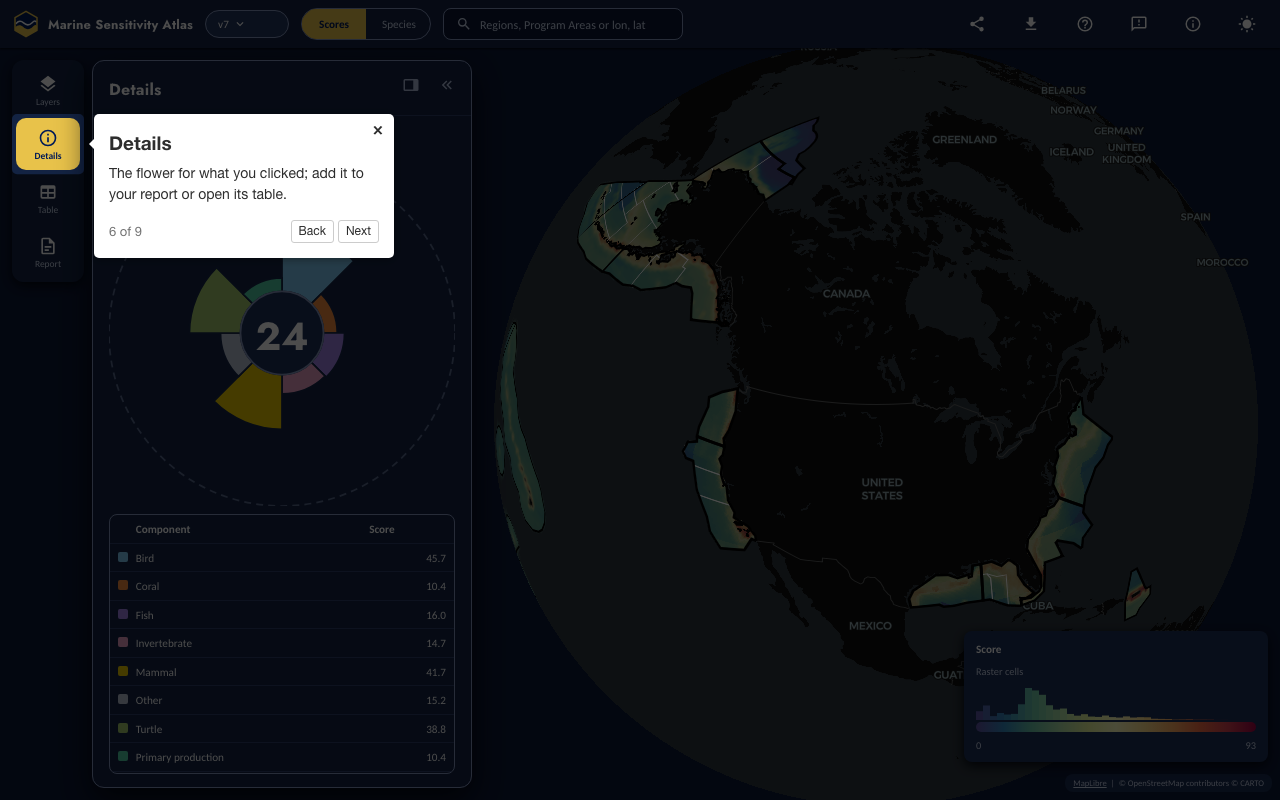
21.1.6 6. Details
The flower for what you clicked; add it to your report or open its table.
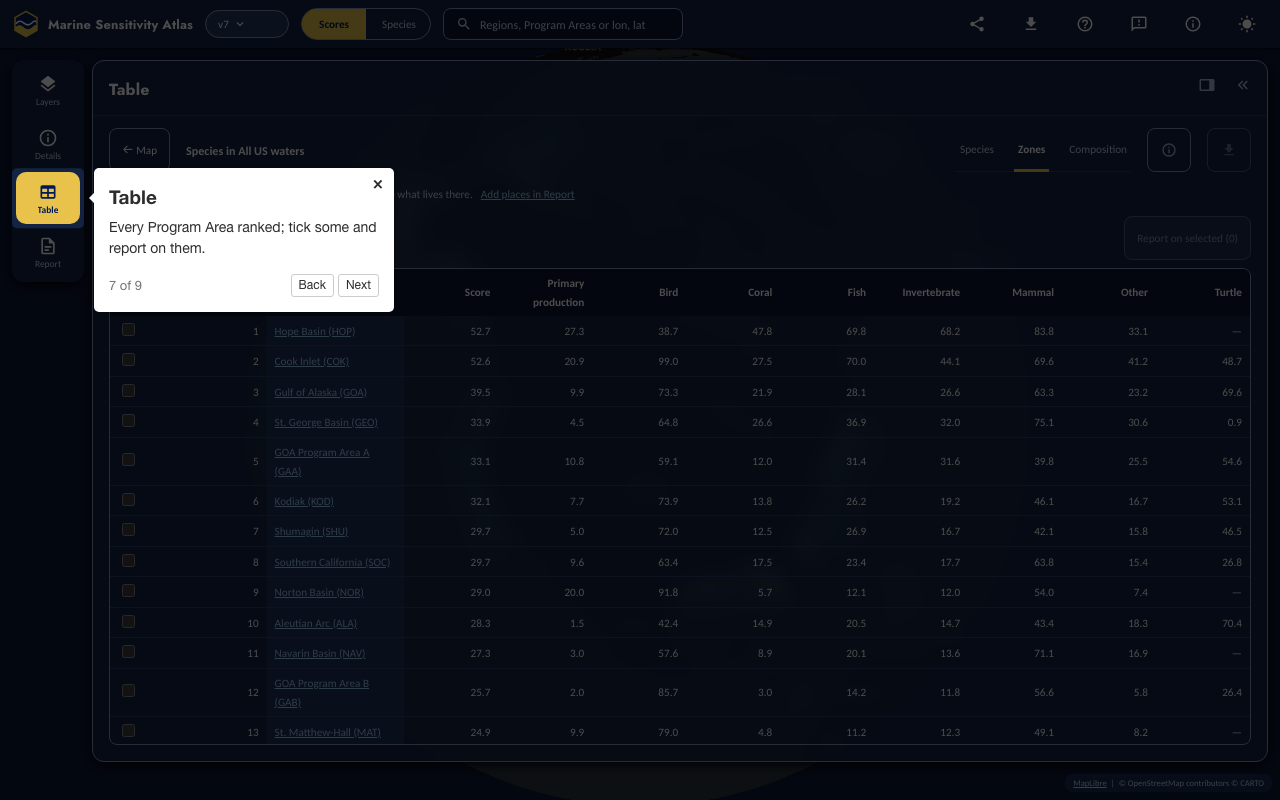
21.1.7 7. Table
Every Program Area ranked; tick some and report on them.
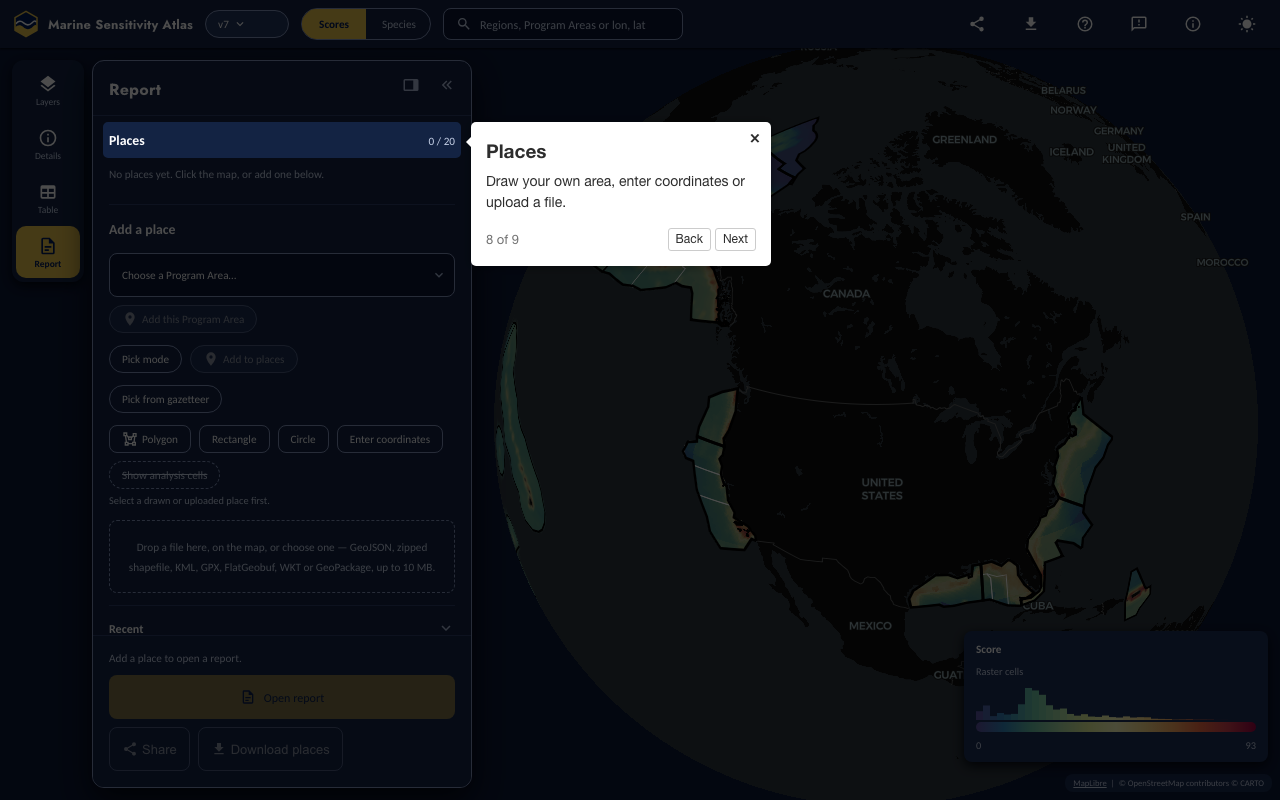
21.1.8 8. Places
Draw your own area, enter coordinates or upload a file.
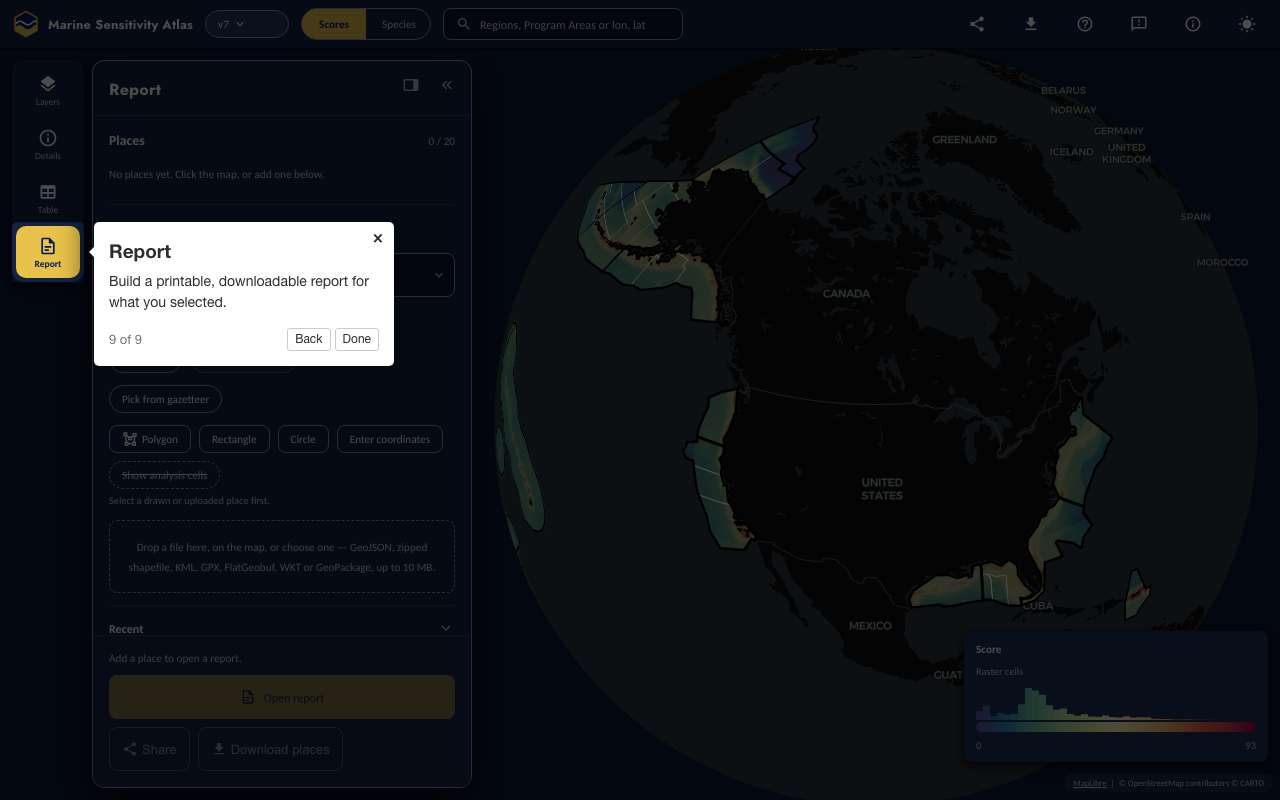
21.1.9 9. Report
Build a printable, downloadable report for what you selected.
21.2 Atlas — Species lens
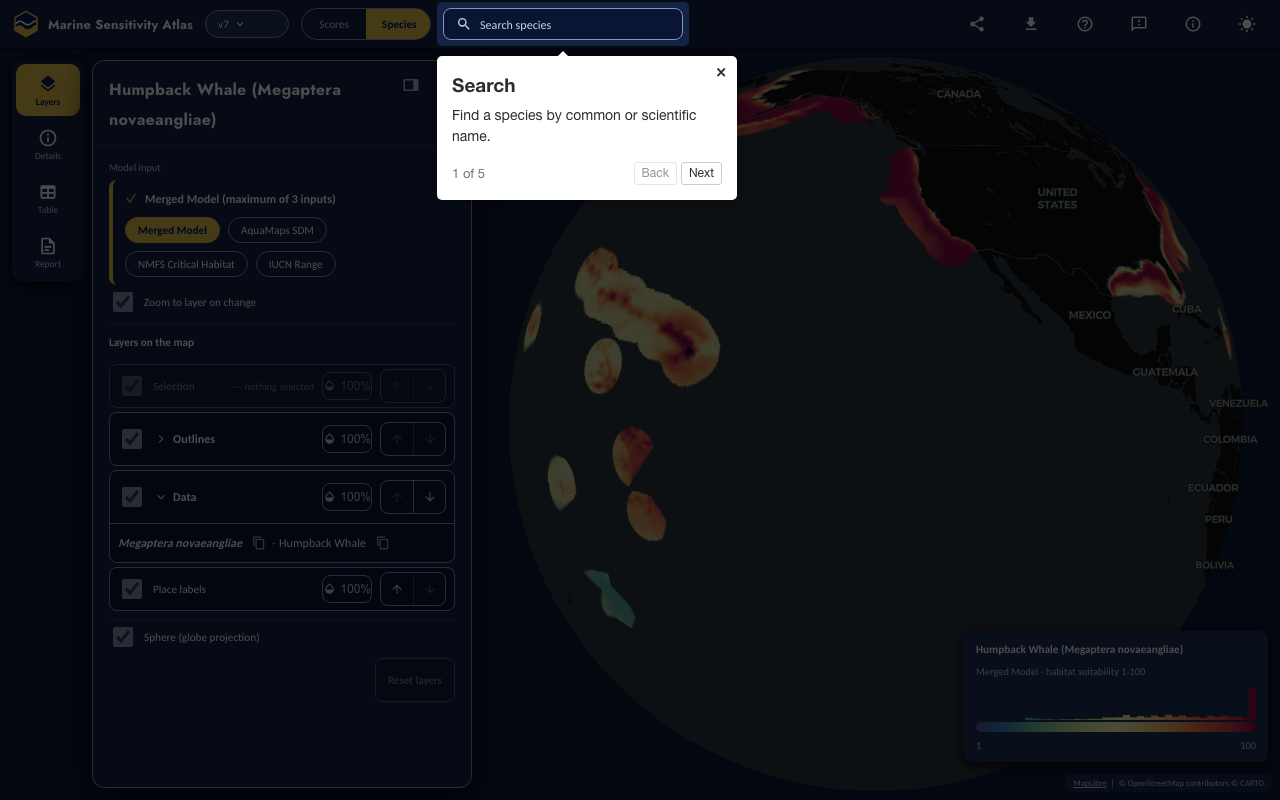
21.2.1 1. Search
Find a species by common or scientific name.
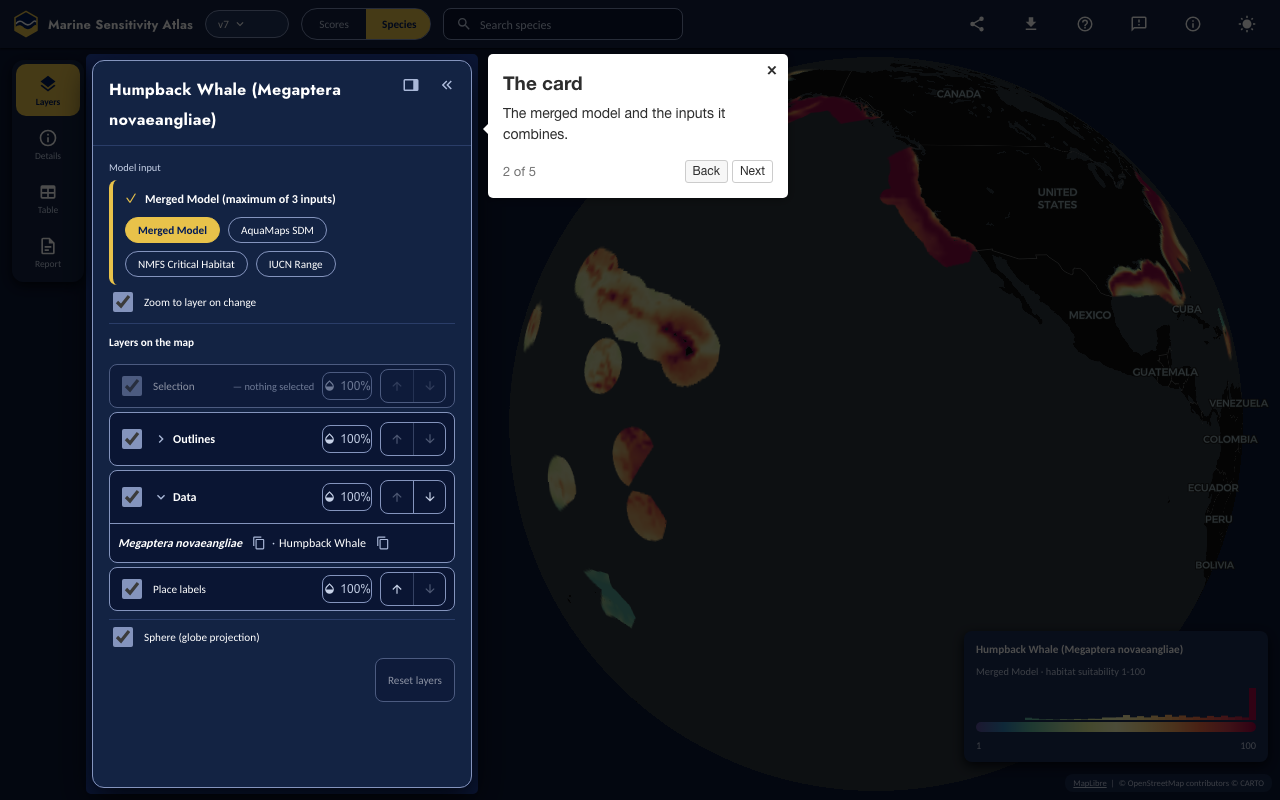
21.2.2 2. The card
The merged model and the inputs it combines.
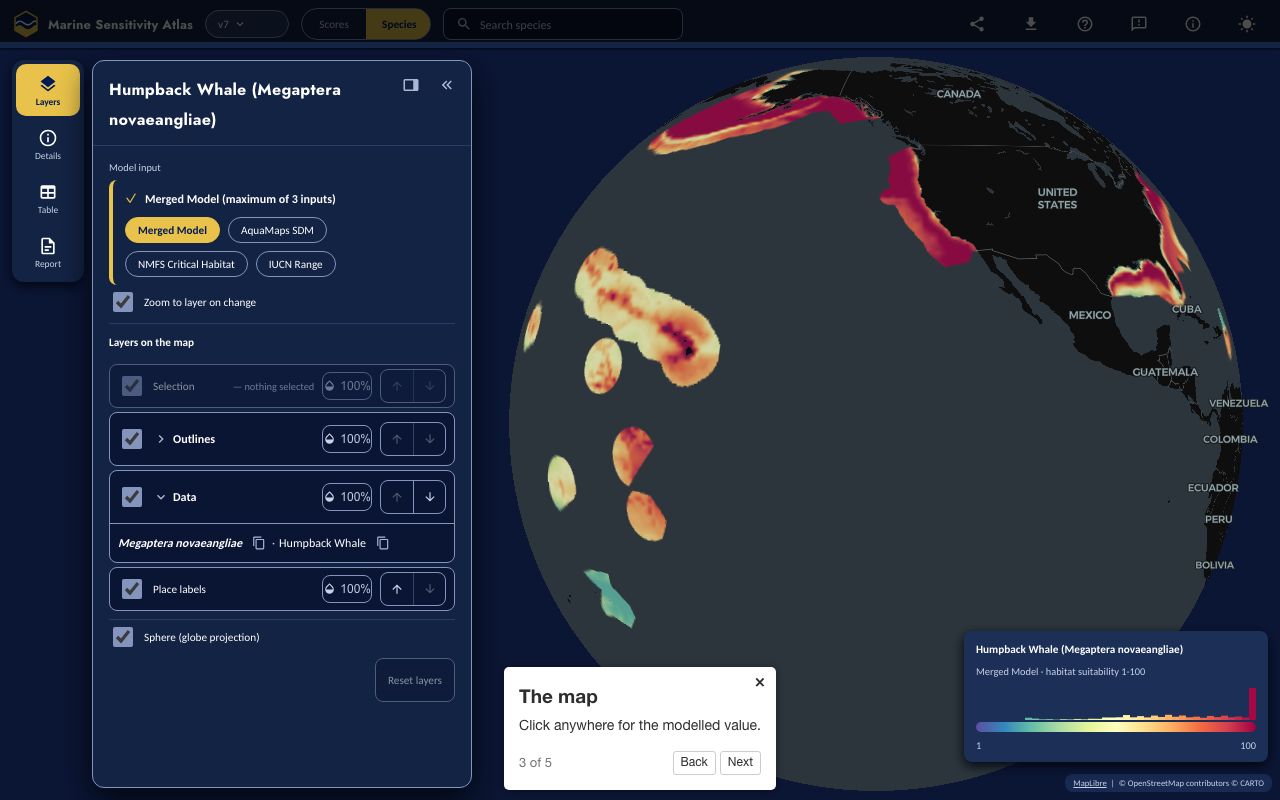
21.2.3 3. The map
Click anywhere for the modelled value.
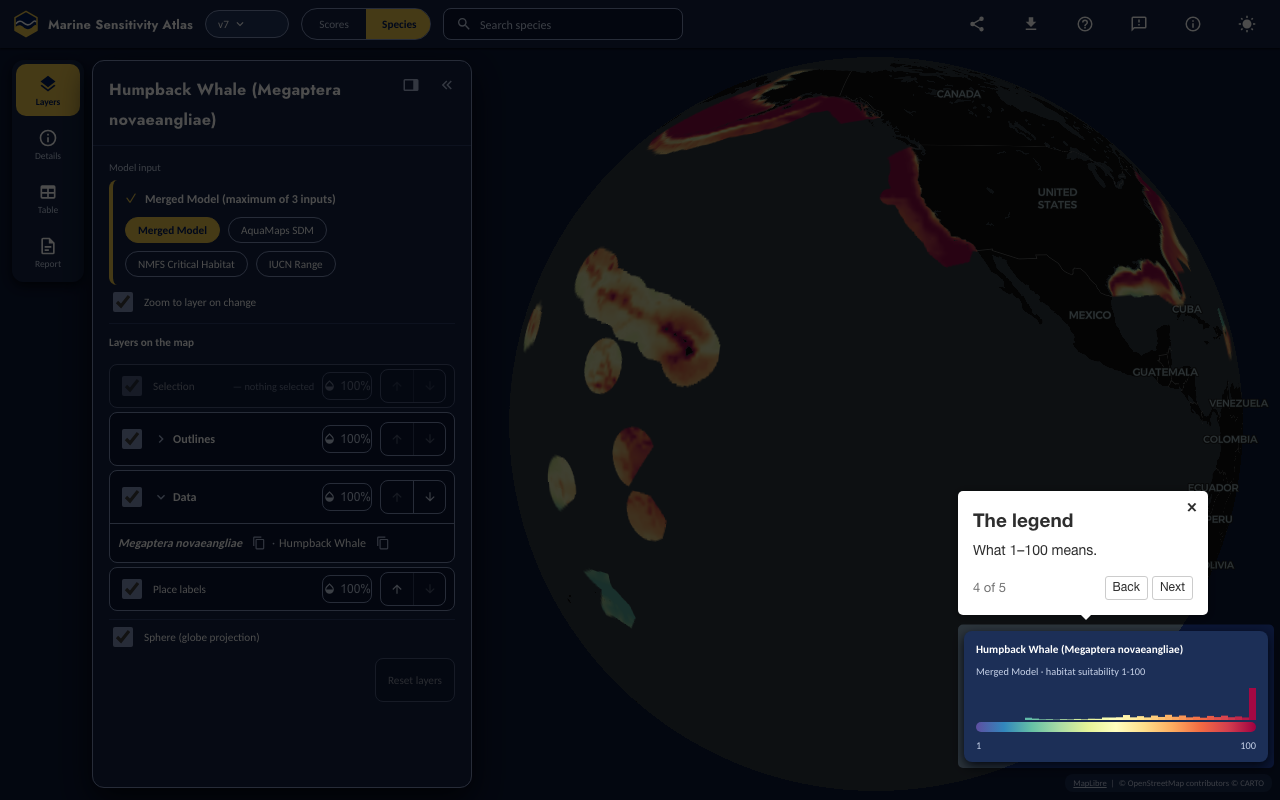
21.2.4 4. The legend
What 1–100 means.
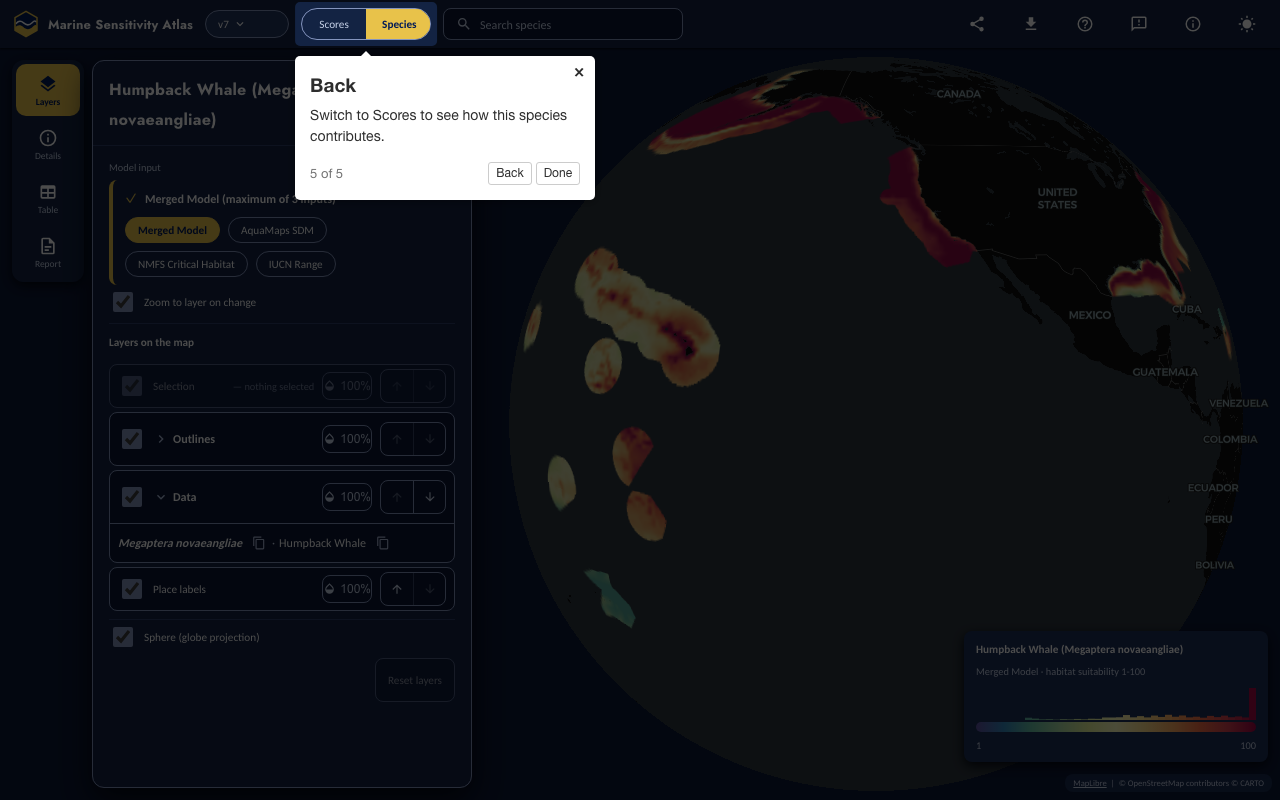
21.2.5 5. Back
Switch to Scores to see how this species contributes.