Marine Sensitivity
Project Documentation

Preface
The Marine Sensitivity Toolkit (MST) is a cloud-native system developed for the Bureau of Ocean Energy Management (BOEM) to assess the sensitivity of marine ecosystems to offshore energy development.
It integrates 17,353 species distribution models with extinction risk assessments across US waters (9,792 of which fall within the 20 BOEM Program Areas of the current program cycle).
Program Areas
Datasets — IUCN Red List range maps added, and used as the global mask — constraining AquaMaps predictions to the expert-assessed range rather than contributing a value of their own.
Methods — A model-merging pipeline is introduced, producing one merged surface per taxon where a taxon has more than one source.
Reported units — The transitional release: scores are reported on both the 36 Planning Areas and the new 20 Program Areas, so the two can be compared directly on the same underlying data. This is the only release that scores both. (measured: 36 planarea, 20 programarea scored on the composite metric.)
Scope — The BOEM Program Areas of the 2026 program cycle are introduced. They do not yet replace the Planning Areas — this release scores both, and the changeover completes at v3.
Technology — Individual model layers are published, and distributions are stored as cloud-optimized GeoTIFFs.
Measured against v1: datasets added: rng_iucn; valid species 17,379 → 17,353; spatial units changed.
Interactive Apps
- Composite scores — sensitivity scores by zone, with flower-plot summaries
- Individual species — individual species distribution models and habitat suitability
- Your area — outline any place in the Atlas (Places) for the same scores and a downloadable report
All three are the Atlas, which renders any published release: substitute the version in the ?ver= query parameter (e.g. ?ver=v3) to view that one (a restricted pre-release is reached only on the review host, at /{version}/atlas/). Links to the former Scores and Species Shiny apps redirect to it.
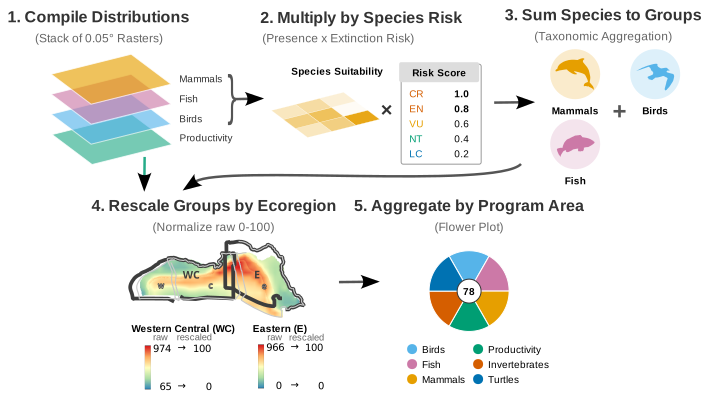
- Scoring walkthrough — step through the scoring pipeline interactively, from input rasters to final scores
Documentation
This book documents the scientific methodology, software infrastructure, and interactive applications that comprise the MST. It is organized in two parts:
- 5 Science — data sources, taxonomic integration, extinction risk scoring, model merging, and sensitivity scoring methodology
- 13 Software — server architecture, databases, workflows, APIs, R libraries, and interactive applications
How to Cite
Best, B.D., T.P. White (2026). Marine Sensitivity Toolkit: Project Documentation. Bureau of Ocean Energy Management, Environmental Studies Program. https://marinesensitivity.org/docs/
Acknowledgments
This work is funded by the BOEM Environmental Studies Program (BOEM-ESP). We thank the data providers whose open datasets make this work possible: AquaMaps, BirdLife International, IUCN Red List, NOAA Fisheries, and U.S. Fish & Wildlife Service.