Marine Sensitivity
Project Documentation

Preface
The Marine Sensitivity Toolkit (MST) is a cloud-native system developed for the Bureau of Ocean Energy Management (BOEM) to assess the sensitivity of marine ecosystems to offshore energy development.
It integrates 17,379 species distribution models with extinction risk assessments across US waters.
Planning Areas
Datasets — AquaMaps global environmental-envelope models supply the distribution of nearly every species, with BirdLife expert ranges for birds. NMFS/FWS critical habitat and FWS ranges are present only as a small pilot. Continuous suitability is used as published; expert range polygons take a 50% presence value by convention, since an extent-of-occurrence boundary asserts presence somewhere within it rather than throughout.
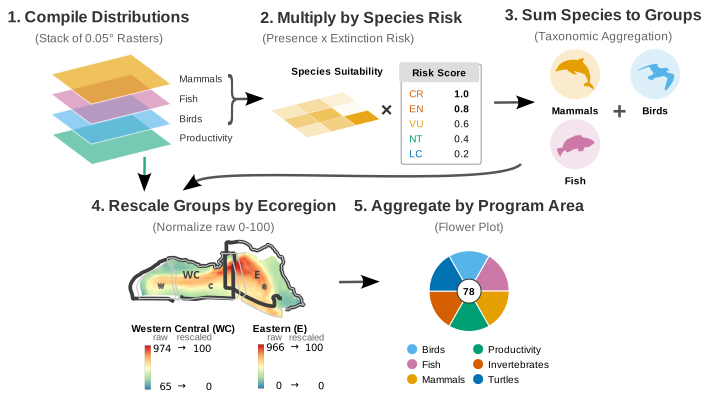
Methods — A cell’s score is the sum, over the species present, of presence × extinction-risk weight, computed separately per species category. Weights are the IUCN equal-steps scale used by the Red List Index and the STAR metric, rescaled so Least Concern keeps a non-zero weight — so overall biological richness stays part of the signal rather than the score being driven entirely by the few threatened species. Cell scores are then rescaled within each BOEM Ecoregion and aggregated by area-weighted mean.
Reported units — Scores are reported on the 36 OCS Planning Areas and the 12 BOEM Ecoregions. v1 predates the Program Areas entirely — its database contains none, which is why a Program Area view of v1 is empty rather than merely uninteresting. (measured: 36 planarea, 12 ecoregion scored on the composite metric.)
Scope — Marine relevance is decided spatially — any model whose distribution reaches the study area is included — with no independent test of whether the species is marine. Models are merged only for the handful of taxa that have more than one source; every other species is scored directly from its single source model.
Technology — A 0.05° geographic (WGS84) grid, chosen because every input arrives on a latitude/longitude grid: analysing in geographic coordinates resamples each input once rather than twice. Area distortion is corrected arithmetically rather than by projection.
Interactive Apps
- Composite scores — sensitivity scores by zone, with flower-plot summaries
- Individual species — individual species distribution models and habitat suitability
- Your area — outline any place in the Atlas (Places) for the same scores and a downloadable report
All three are the Atlas, which renders any published release: substitute the version in the ?ver= query parameter (e.g. ?ver=v3) to view that one (a restricted pre-release is reached only on the review host, at /{version}/atlas/). Links to the former Scores and Species Shiny apps redirect to it.
- Scoring walkthrough — step through the scoring pipeline interactively, from input rasters to final scores
Documentation
This book documents the scientific methodology, software infrastructure, and interactive applications that comprise the MST. It is organized in two parts:
- 5 Science — data sources, taxonomic integration, extinction risk scoring, model merging, and sensitivity scoring methodology
- 13 Software — server architecture, databases, workflows, APIs, R libraries, and interactive applications
How to Cite
Best, B.D., T.P. White (2026). Marine Sensitivity Toolkit: Project Documentation. Bureau of Ocean Energy Management, Environmental Studies Program. https://marinesensitivity.org/docs/
Acknowledgments
This work is funded by the BOEM Environmental Studies Program (BOEM-ESP). We thank the data providers whose open datasets make this work possible: AquaMaps, BirdLife International, IUCN Red List, NOAA Fisheries, and U.S. Fish & Wildlife Service.