These are numerous so probably require a database or other tiling strategy to serve (vs native R).
4 Wind Energy
Other:
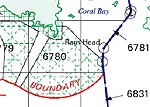
Wind Energy Areas
Wind Energy Leases
Wind Energy Planning Areas
Renewable Energy - GIS Data | BOEM Renewable Energy Leases and Planning Areas
Boundaries of renewable energy lease areas, wind planning areas, and marine hydrokinetic planning areas.
Oil & Gas Energy - Maps and GIS Data | BOEM GIS Data/Shapefiles
Download GIS data files for BOEM Offshore block grids, boundaries, active leases, wells, pipelines, and more.
Source Code
---title: "explore_blocks"execute: keep-md: trueeditor_options: chunk_output_type: console---## GoalWhat are the spatial analytical units for which we should report sensitivity indicators?## Hierarchy: Shelf > Region > OPD > Block > Aliquotspatial units: `shlf` > `rgn` > `opd` > `blk` > `alq`And fields to apply to each:- `{unit}_id` (integer)- `{unit}_key` (character)- `{unit}_name` (character)- `opd` Official Protraction Diagrams (OPDs) (2 degrees wide by one degree high) - `blk` Blocks (2304 hectares; 4800 x 4800 meters on a UTM). - `alq` Aliquot (144 hectares)BUT very inconsistent -- see:- Google Drive\`msens/data/raw/boem.gov/blocks/`[`README`](https://docs.google.com/document/d/1jpW3As6sve5LkI7r8Os3YpDk8zyBMz2r3_2irFHzorc/edit?usp=sharing)## Aliquots- [BOEM Block **Aliquot** \| MarineCadastre](https://marinecadastre-noaa.hub.arcgis.com/maps/2c9c651c500043d88b471de46b5e89b5/about): dense so requires pgis db to pg_tile serviceThese are numerous so probably require a database or other tiling strategy to serve (vs native R).## Wind EnergyOther:- Wind Energy Areas - Wind Energy Leases- Wind Energy Planning Areas[Renewable Energy - GIS Data \| BOEM](https://www.boem.gov/renewable-energy/mapping-and-data/renewable-energy-gis-data)\**Renewable Energy Leases and Planning Areas**\Boundaries of renewable energy lease areas, wind planning areas, and marine hydrokinetic planning areas.\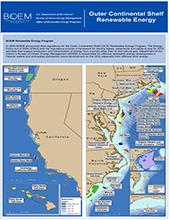```{r wind}# libraries ----librarian::shelf( dplyr, glue, janitor, here, knitr, leaflet, leaflet.extras, # mapview, rmapshaper, sf,quiet = T)# paths ----dir_data <-"/Users/bbest/My Drive/projects/msens/data"wind_gdb <-glue("{dir_data}/raw/boem.gov/BOEMWindLayers_4Download.gdb")lse_geo <-glue("{dir_data}/raw/boem.gov/BOEM_Wind_Leases_9_27_2023.geojson")pln_geo <-glue("{dir_data}/raw/boem.gov/BOEM_Wind_Planning_Areas_10_06_2023.geojson")(d_wind_lyrs <-st_layers(wind_gdb, do_count = T))wind_lyrs <- d_wind_lyrs$nameply_wind_lse <-read_sf(wind_gdb, wind_lyrs[3]) # BOEM_Wind_Leases_9_27_2023ply_wind_pln <-read_sf(wind_gdb, wind_lyrs[5]) # BOEM_Wind_Planning_Areas_10_06_2023ply_wind_lse_s05 <- ply_wind_lse |>ms_simplify(keep=0.05, keep_shapes=F)ply_wind_pln_s05 <- ply_wind_pln |>ms_simplify(keep=0.05, keep_shapes=F)# mapView(# ply_wind_lse_s05,# layer.name = "Wind Leases",# col.regions = "red") +# mapview(# ply_wind_pln_s05, # layer.name = "Wind Planning Areas",# col.regions = "green")msens::ms_basemap() |>addPolygons(data = ply_wind_lse_s05, weight =1,color ="blue",fillColor ="blue",label =~glue("{COMPANY}: block {BLOCK_NUMBER}")) |>addPolygons(data = ply_wind_pln_s05, weight =1,color ="green",fillColor ="green",label =~glue("{PRIMARY_WPA_CATEGORY}: block {BLOCK_NUMBER}")) |>addLegend(labels =c("Leases", "Planning Areas"),colors =c("blue", "green"),opacity =0.8,position ="bottomright") |>addFullscreenControl()```## Oil & Gas Energy[Oil & Gas Energy - Maps and GIS Data \| BOEM](https://www.boem.gov/oil-gas-energy/mapping-and-data)\**GIS Data/Shapefiles**\Download GIS data files for BOEM Offshore block grids, boundaries, active leases, wells, pipelines, and more.\